◐ Shell
reader mode source ↗
Skip to content
GitHub Discussions

Ask questions, share ideas, and build connections with each other—all right next to your code. GitHub Discussions enables healthy and productive software collaboration.

Screenshot of a GitHub Discussions page for the ’octoinvaders’ project, showing categorized discussion threads with tags like ’answered’ and ’Long term.’ The interface features playful elements like a mona emjoi and a rocket icon, highlighting community interaction.

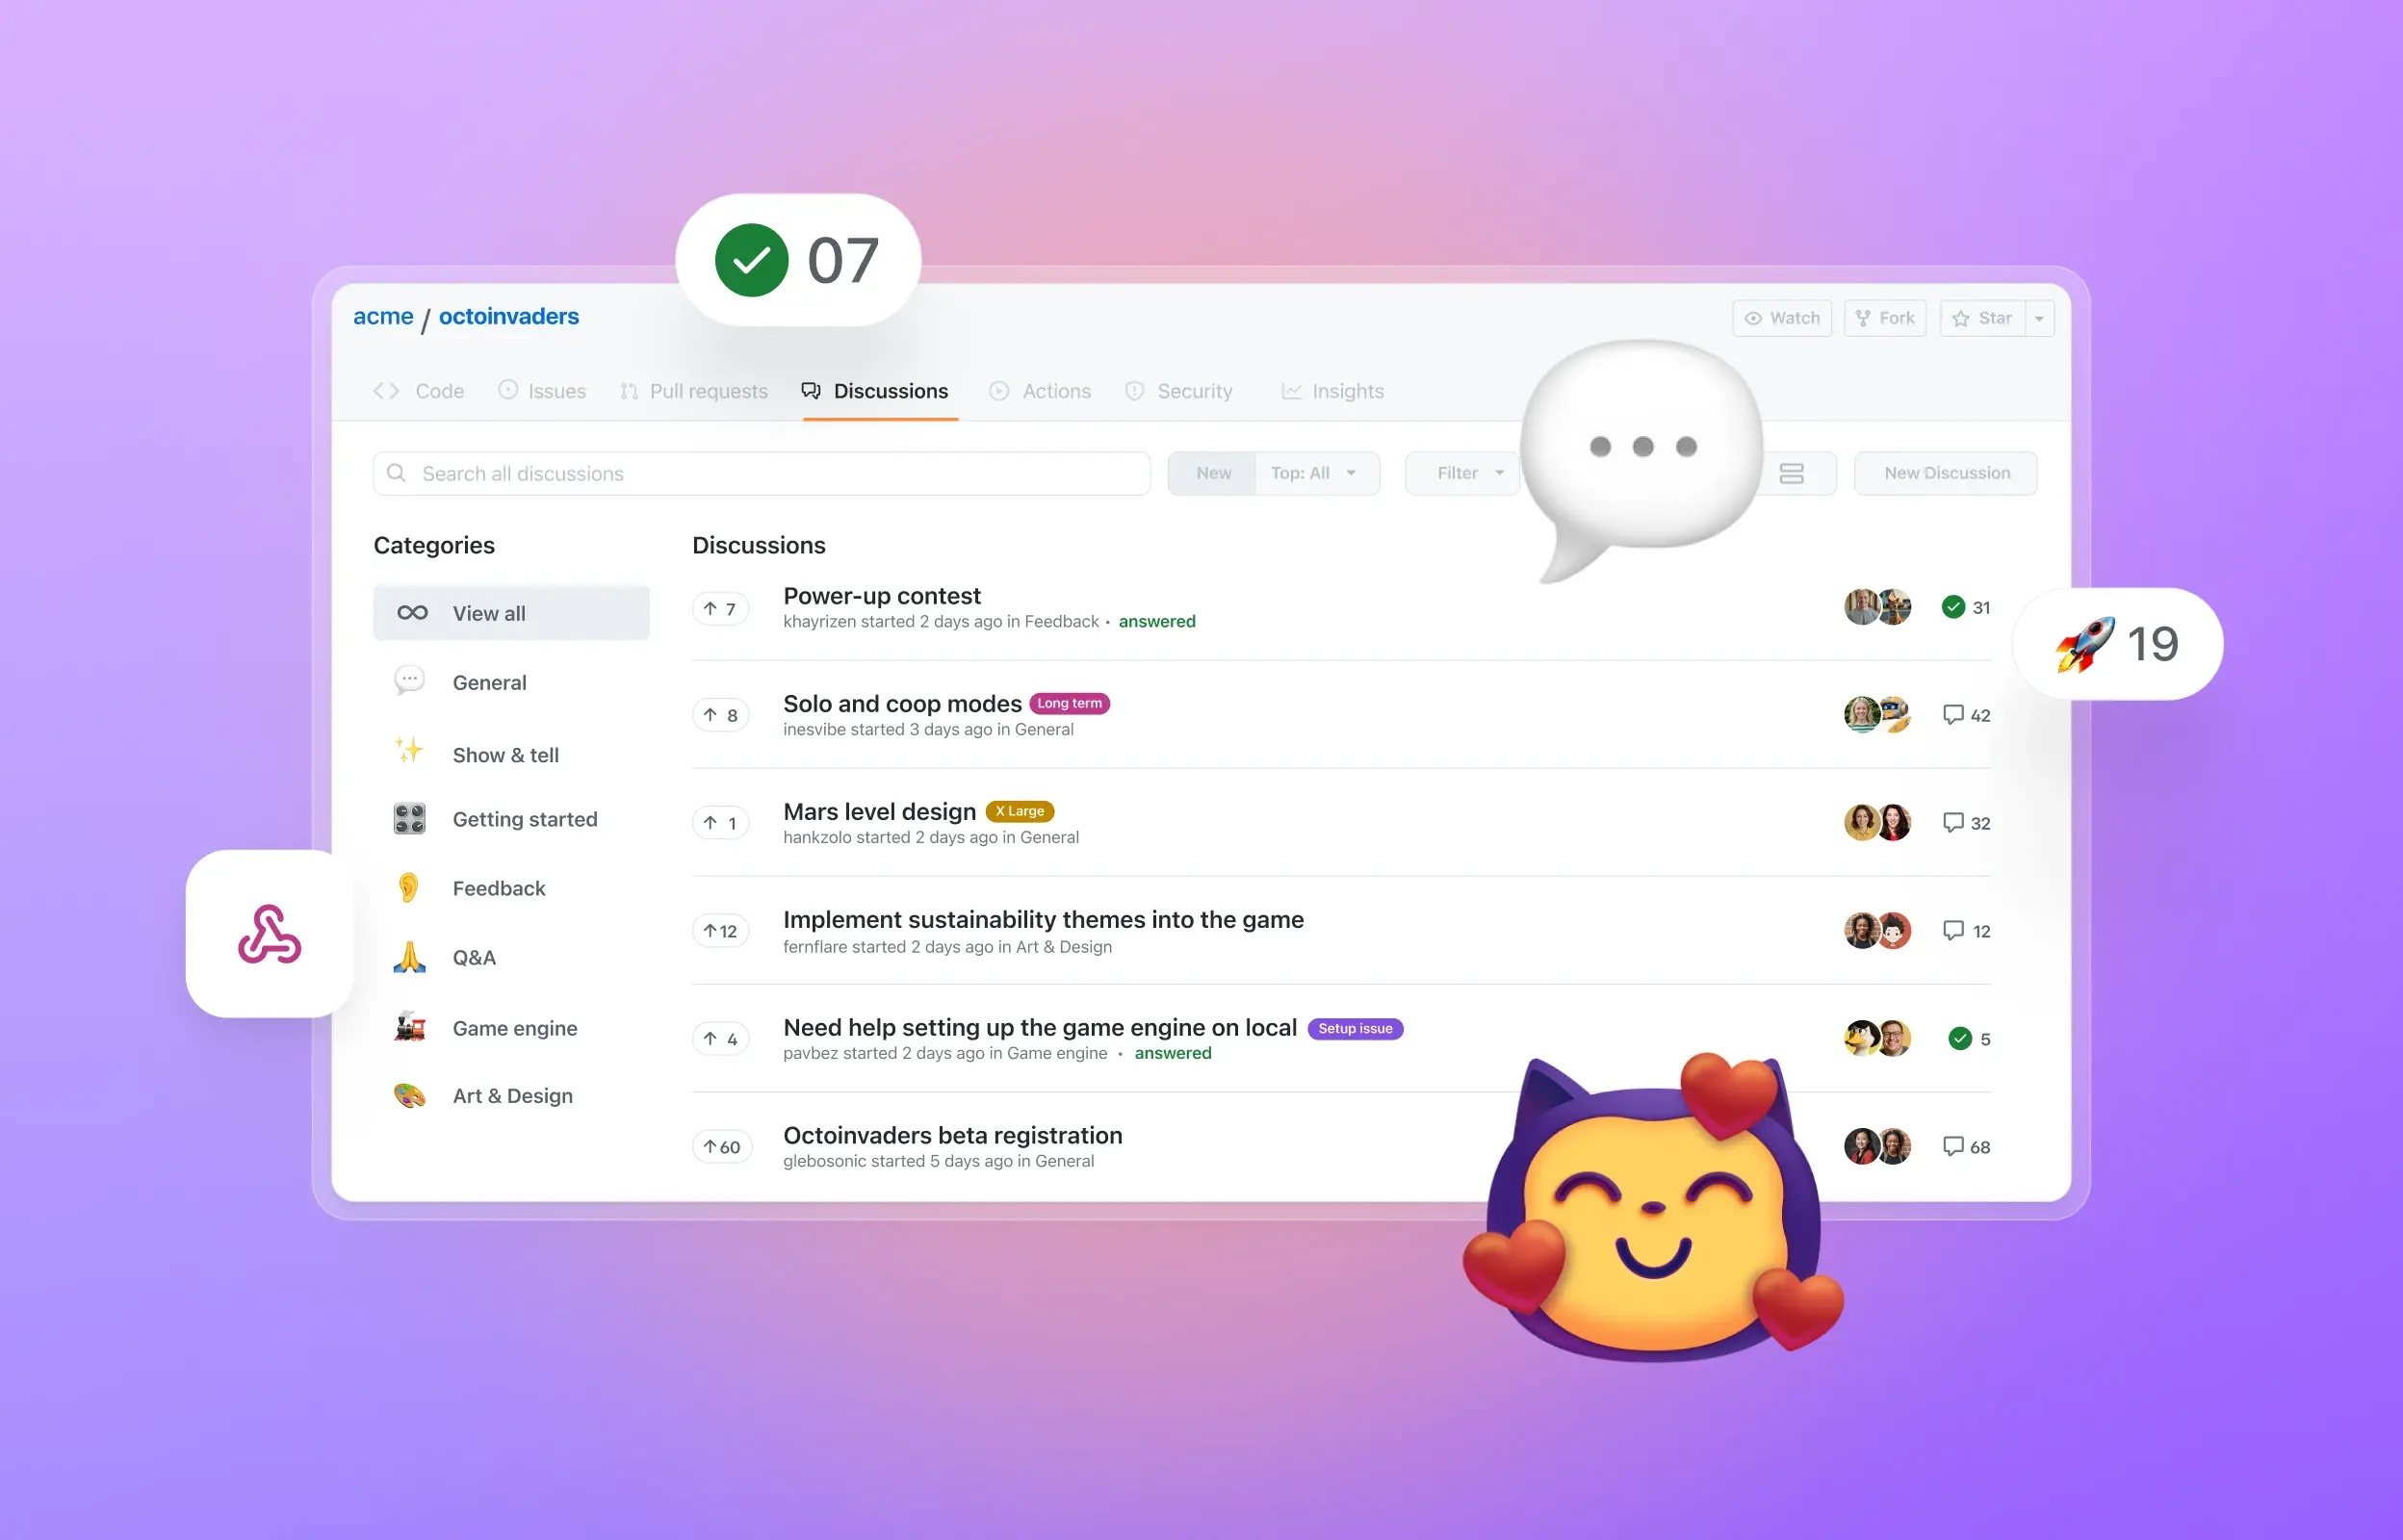
Dedicated space for conversations

Decrease the burden of managing active work in issues and pull requests by providing a separate space to host ongoing discussions, questions, and ideas.

Monitor insights

Track the health and growth of your community with a dashboard full of actionable data.

The image is a line graph showing data trends over time for issues, discussions, and pull requests. The x-axis represents dates from March 4th to April 4th, and the y-axis represents the number of occurrences ranging from 0 to 15. The graph includes a solid blue line for issues, a green dotted line for discussions, and a purple dashed line for pull requests.

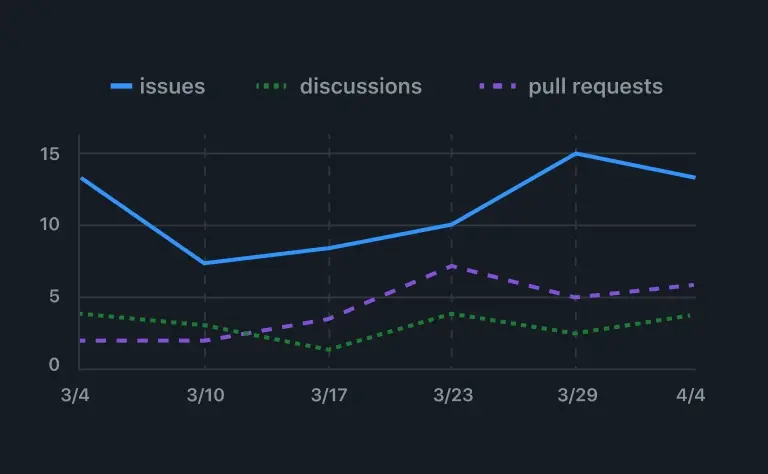
Contribution activity

Count of total contribution activity to Discussions, Issues, and PRs.

The image is a bar chart showing user activity over several dates. The x-axis represents dates (3/8, 3/14, 3/20, 3/26, 4/1, and 4/7), and the y-axis represents the number of users ranging from 0 to 30. Only blue bars, representing "logged in" users, are present. The heights of the blue bars vary: around 5 on 3/8, around 15 on 3/14, around 30 on 3/20, around 20 on both 3/26 and 4/1, and around 15 on 4/7.

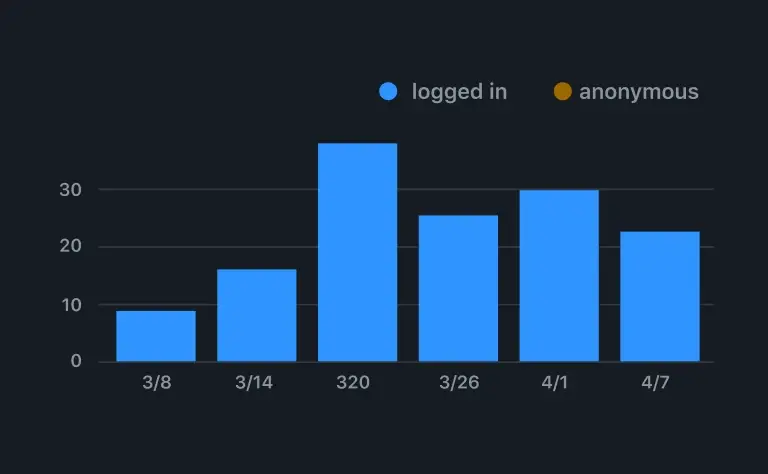
Discussion page view

Total page views to Discussions segmented by logged in vs anonymous users.

The image is a line graph showing data points over time from March 4th to April 4th. The x-axis represents dates, and the y-axis represents numerical values from 0 to 20. The blue line starts at approximately 16 on March 4th, dips to around 14 on March 10th, rises slightly to about 15 on March 17th, drops to roughly 9 on March 23rd and March 29th, and then sharply increases to a peak value of around 20 on April 4th.

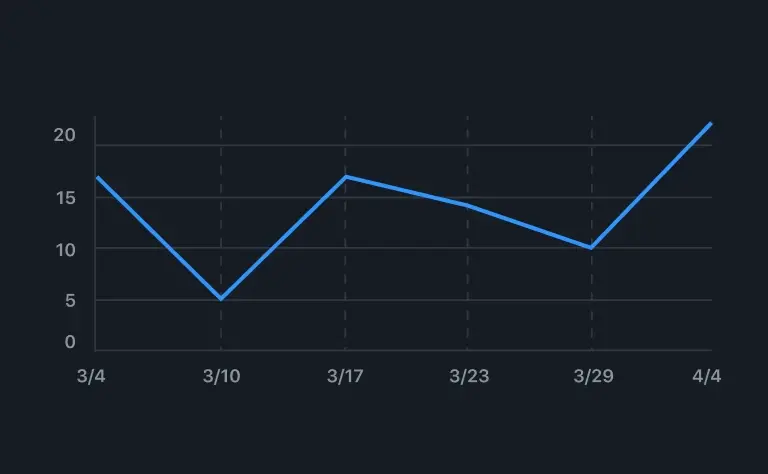
Discussions daily contributors

Count of unique users who have reacted, upvoted, marked an answer, commented, or posted in the selected period.