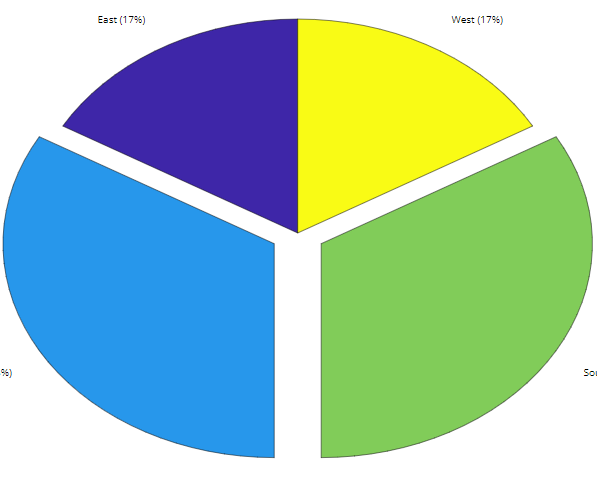
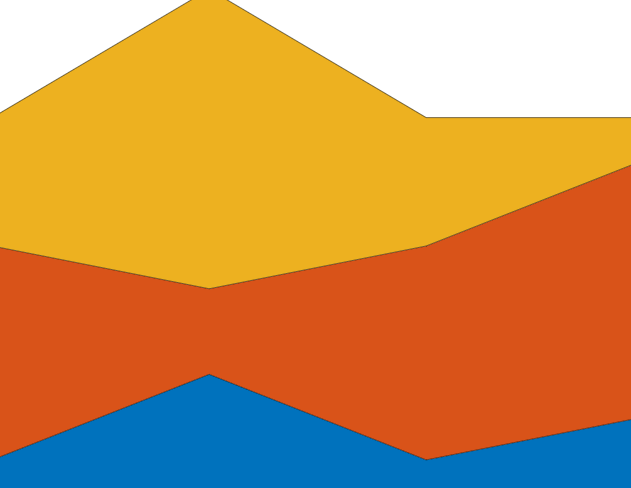
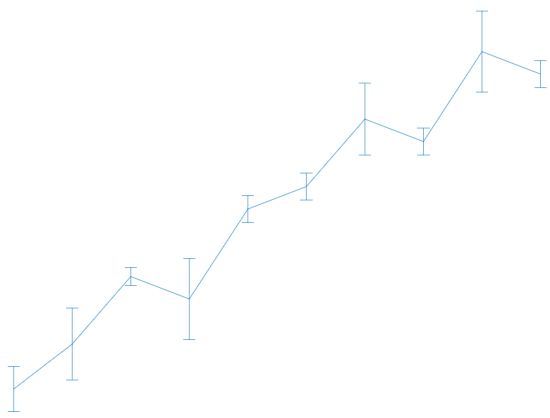
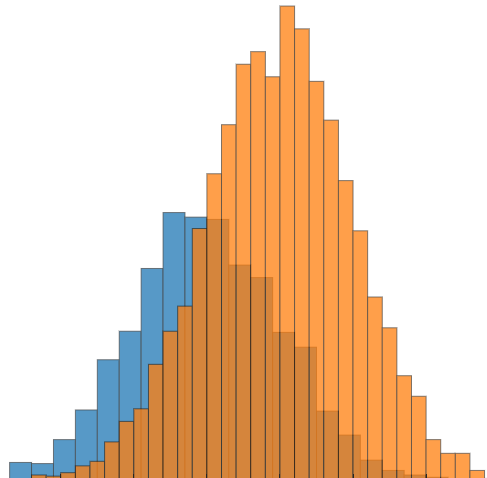
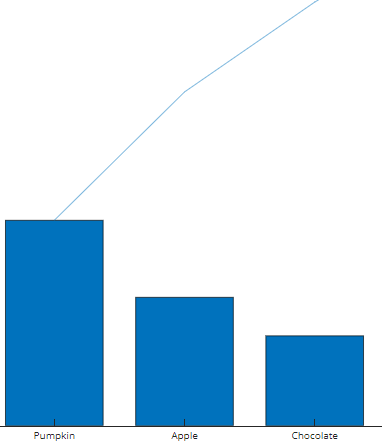
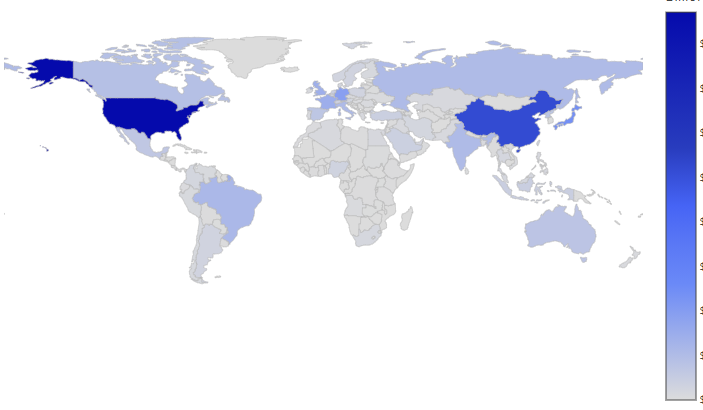
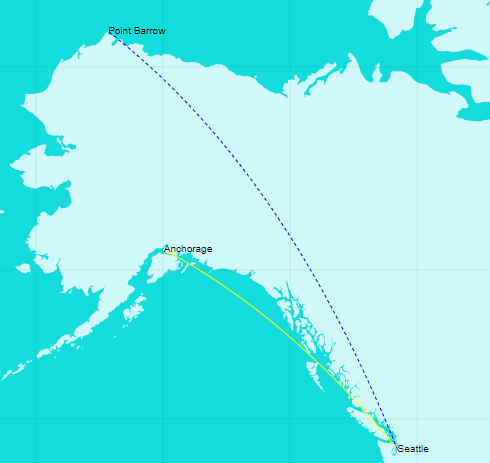
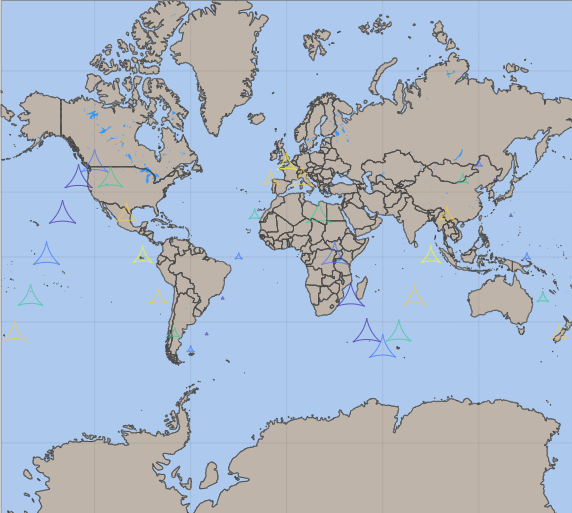
Plotly Fundamentals More Fundamentals » Axes View Tutorial Legends View Tutorial Setting Graph Size View Tutorial Formatting Ticks View Tutorial Setting the Font, Title, Legend Entries, and Axis Titles View Tutorial Basic Charts More Basic Charts » Scatter Plots View Tutorial Line Charts View Tutorial Bar Charts View Tutorial Pie Charts View Tutorial Filled Area View Tutorial Statistical Charts More Statistical Charts » Error Bars View Tutorial Histograms View Tutorial Distplots View Tutorial 2D Histograms View Tutorial Scatterplot Matrix View Tutorial Scientific Charts More Scientific Charts » Contour Plots View Tutorial Heatmaps View Tutorial Imshow View Tutorial Ternary Plots View Tutorial Log Plots View Tutorial Financial Charts More Financial Charts » Time Series and Date Axes View Tutorial Box Plots View Tutorial Waterfall Plots View Tutorial OHLC Plots View Tutorial Pareto Plots View Tutorial Maps Choropleth Maps View Tutorial Lines on Maps View Tutorial Scatter Plots on Maps View Tutorial Bubble Maps View Tutorial Artificial Intelligence and Machine Learning ML Regression View Tutorial PCA Visualization View Tutorial t-SNE projections View Tutorial 3D Charts More 3D Charts » 3D Line Plots View Tutorial 3D Scatter Plots View Tutorial 3D Surface Plots View Tutorial Trisurf Plots View Tutorial 3D Mesh Plots View Tutorial Subplots Subplots View Tutorial Mixed Subplots View Tutorial 3D Subplots View Tutorial Advanced LaTeX MATLAB® is a registered trademark of The MathWorks, Inc.